From 2012 all air quality complaints are to be reported to the EPA, however, only major incidents will be investigated.
24 / 7 Hotline number: 1800 005 171.
Email: incidentresponse@environment.tas.gov.au
24 / 7 Hotline number: 1800 005 171.
Email: incidentresponse@environment.tas.gov.au
Air quality readings as per the National Environment Protection Messure for PM10 and PM2.5
are daily averaged (Midnight to midnight)
There is no standard shorter than this for PM's. Health problems can result as a result of this
as explained in the Guide above.
Readings can be high for a good part of the day but if the 50mg/m3 Pm10, and 25mg/m3
PM2.5 average is not breached then there would not be an exceedence of the NEPM
Standard.
There is no Visible Reducing Index in Tasmania like in Victoria.
09.04.2010 - EPA network to help solve air mysteries
22.04.2010 - EPA to investigate Gunns/Forestry plannedburn smoke.
11.06.2010 - No action over Gunns/Forestry burns.
National Pollution Inventory (NPI) PM10 and PM2.5 national figures.
Comprehensive information in relation to Tasmanian air quality can be found on the EPA - Air website.
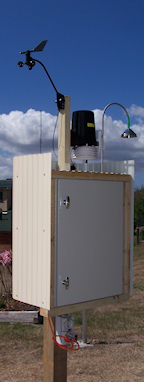
Go here to read Tasmania's Indicative Pm2.5 and PM10 Real Time Air Quality Data - updated every 10 minutes from the Base-Line Air Network for EPA Tasmania system (BLANkET).
In the main these real-time readings cannot be used to determine if there has been an exceedance of the Ambient Air - National Environment Protection Measure. (Air NEPM).
The light scattering lazer particle counters are an equivalent measuring instrument under the current Australian NEPM Standards. They give us an almost real - time air quality reading whereas it can take several weeks to get a validated air quality reading from a gravimetric (weight of particles, not number of particles) style monitor.
Depending on pollution source, wind direction, and where fixed air monitors are positioned, it is possible there will be gaps in our air monitoring. Mobile or portable monitors are being used to 'plug some of these holes'.
An interesting Guide to Estimating (outdoor) Particle Matter
Clorado DPHE
Clorado DPHE

Air Quality Monitoring
Then this....
Environment Ministers Council Abolished
Australias environment ministers will no longer meet as a group to tackle common environmental issues.
The COAG Standing Council on Environment and Water was abolished at the councils meeting on 13 December 2013, the first since the federal Coalition was elected. Too much bureaucracy and red tape has grown up around COAG, the meeting communiqué said. COAG decided 22 standing committees should be streamlined and refocused on COAGs priorities over the next 12-18 months. Of the eight new committees none will deal with environment, water or climate change issues.
In Victoria there is a Visibility Reducing Particles NEPM with a 1 hour averaging period, a 20Km objective, and a goal of 3 days a year maximum.
Air Visual : Go here to read the air quality index (AQI) anywhere in the world.
NOTE: These readings are wrong. Tasmania does not convert its raw readings to AQI.
Cleanairtas believes that AQI readings are not the way to go and that individual pollution readings are much more meaningful for many valid reasons - see more below.
NOTE: These readings are wrong. Tasmania does not convert its raw readings to AQI.
Cleanairtas believes that AQI readings are not the way to go and that individual pollution readings are much more meaningful for many valid reasons - see more below.
28 October 2014 - BLANkET wins Werner Strauss Clean Air Achievement Award.
Dr John Innis accepts the award on behalf of the Tasmanian EPA team from Ms Polly Strauss.
Photo courtecy of CASANZ
Dr John Innis accepts the award on behalf of the Tasmanian EPA team from Ms Polly Strauss.
Photo courtecy of CASANZ
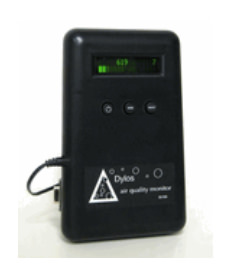
DYLOS DC1100 Pro air quality monitor with PC interface.
Cleanairtas recommends this low cost true lazer particle counter with 2 size ranges.
This instrument can hold it's own alongside much higher priced air quality monitors.
Prices are in US dollars and it is advisable to purchase an additional serial-to-USB converter to connect it to your computer.
November 2018 - DC1700 model:
Provides particle concentration by size (>0.5 and > 2.5 micron) to correlate with ISO standards"
· Provides particle mass in PM2.5 and PM10 to correlate with EPA
· Convenient switching between particle concentration and particle mass.

Hobart health risked by cruise ships?
Background Briefing's shocking report
EPA's position with regards to ships in Hobart
"Ship engine exhaust emissions in waters around Australia -an overview" by L Goldsworthy and I.E. Galbally
http://www.abc.net.au/news/2015-05-28/nsw-port-authority-suspends-overnight-ship-berthing/6502302
Background Briefing's shocking report
EPA's position with regards to ships in Hobart
"Ship engine exhaust emissions in waters around Australia -an overview" by L Goldsworthy and I.E. Galbally
http://www.abc.net.au/news/2015-05-28/nsw-port-authority-suspends-overnight-ship-berthing/6502302
Mercury 11 2015 Photo.
NEPMs in Tasmania
In Tasmania, NEPMs are State Policies in accordance with section 12A of the
State Policies and Projects Act 1993. They are generally not directly
enforceable and are implemented using a variety of mechanisms and
approaches depending on the particular contents of each NEPM.
Information on how each of the NEPMs is being implemented in Tasmania can
be found in NEPC annual reports.
Under federal Liberal, the Environment Minister (Greg Hunt) had the chance, with state and territory environment ministers, to lower all our Australian air quality standards and to change PM2.5 from being just an advisory standard into a compliance standard. Disappointedly he chose not to. - ABC Lateline with Emma Alberici 4/7/2016
'Powership' will investigate even though they claim,
"...The issue of smoke pollution has not come up...."
Click on the above picture to read the article
"...The issue of smoke pollution has not come up...."
Click on the above picture to read the article

EPA awards US$4.5 Million to advance air monitoring
Air Quality: Where there is smoke there is pollution
Air Quality: Where there is smoke there is pollution
EPA Tasmania ceased dockside air monitoring in September 1920
Our EPA IS NOT charged with monitoring on-board vehicular/passenger ferry air quality.
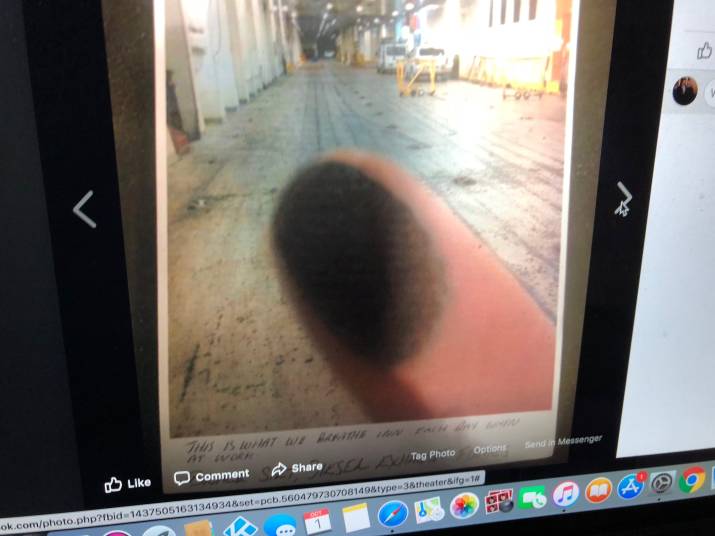
Click on the picture below to download about black dust on Spirit I & II of Tasmania.
These are the state-owned TT-Line passenger/vehicular ferries that run between Tas. and the mainland.
Click on the picture below to download about black dust on Spirit I & II of Tasmania.
These are the state-owned TT-Line passenger/vehicular ferries that run between Tas. and the mainland.
22.9.2021 - WHO's new Air Quality Guidelines released.
The WHO has stuck to 24 hour averaging for PMs. Why?
Tasmania uses 1 hour rolling average.
The WHO has stuck to 24 hour averaging for PMs. Why?
Tasmania uses 1 hour rolling average.
This is a must watch video . New Smoke Forecasting System
.for Australia, for Tasmania.
AFAC's Predictive Services Systems Working Group sponsored a webinar on 19 December to demonstrate the Bureau of Meteorologys new Smoke and Air Quality Forecasting System (AQFx) modelling application for forecasting smoke and air quality .in Tasmania.
Published on Jan 7, 2018:
https://www.youtube.com/watch?v=WKeHpw7s3No
I asked BoM is it being used in Tas.
This was their reply:
We are currently using the AQFx system internally to predict smoke travel in Tasmania.
As this is still an experimental system, the results are not available to the general public. Some emergency management and land management agencies are able to see the smoke forecasts via a registered user page.
The system can predict smoke from planned burns prior to the burn taking place as well as smoke from existing planned burns or wild fires. The facility to predict smoke from planned burns depends on getting information on these burns from other agencies, and this may not currently be implemented in all jurisdictions.
So now I ask the question again.
If we have the means to PREDICT smoke travel before (and after) a deliberate outdoor burn, why are people being forced to breathe this toxic smoke?
Right to Information - May 2019 - TT-Line's Decision not to release reports on it's on-board air monitoring.
Global forecast plots.
Every day, the Copernicus Atmospheric Service (CAMS) provides five-day forecasts of aerosols, atmospheric pollutants, greenhouse gases, stratospheric ozone and the UV-Index.
Clink on the Atmoshheric Monitoring Service above.
The Copernicus Atmosphere Monitoring Service supports many applications in a variety of domains including health, environmental monitoring, renewable energies, meteorology and climatology.

Looking at our planet and its environment
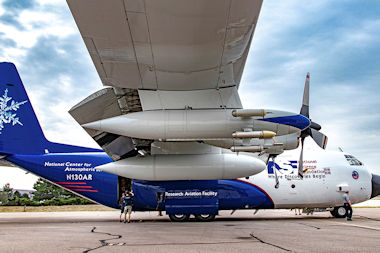
This summer, NOAA and NASA are teaming up on a massive research campaign called FIREX-AQ that will use satellites, aircraft, drones, mobile and ground stations to study smoke from wildfires and agricultural crop fires across the U.S. Hundreds of scientists will explore the chemistry of trace gases and aerosols in smoke to uncover its secrets, improve weather and air quality models, and provide better forecasts to first responders, public health and land management officials. ... ".
Where theres fire theres smoke and secrets for science to uncover
Where theres fire theres smoke and secrets for science to uncover
Scientists fly C-130 into the heart of smoke plumes - click on the photo
Poor air quality isn't just unhealthy. It's expensive.
National Centre for Atmospheric Research
National Centre for Atmospheric Research
Calls for air quality monitoring as northern NSW braces for severe bushfire season
More than 500,000 people live between Tweed Heads and Newcastle.
None of the State Government's network of 85 permanent air monitors are located between Tweed Heads and Newcastle.
Now, DPIE's director of climate and atmospheric science, Matthew Riley, said establishing a station on the North Coast was a priority because of its significant population growth.
The DPIE would "undoubtedly" be monitoring on the North Coast within the next five years, he added.
A pair of 16ft lungs made from steel, wood and fibreglass were installed beside City Hall today to help visualise the impact of pollution on Londoners breathing.
84% of Londoners surveyed were worried about health risks from toxic particles in their airways.
The lungs are filled with different colours of smoke to represent levels of different pollutants inhaled in the capital every day.
84% of Londoners surveyed were worried about health risks from toxic particles in their airways.
The lungs are filled with different colours of smoke to represent levels of different pollutants inhaled in the capital every day.
THE AQI SYSTEM FOR REPORTING AIR QUALITY IS REDICULOUS!
Have a look at THIS PAGE trying to describe the Air Quality Index (AQI) used in the US for example.
No wonder people are confused with ambient air quality readings.
Why make it so complicated using formulas and colours and numbers that go up to 500!
Give us the raw PM2.5/PM10 data straight off the instruments.
And it works out different in different countries!!
We don't have to put up with this....
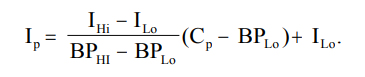
The Air Quality Index (AQI) (also known as the Air Pollution Index (API) or Pollutant Standard Index (PSI)!! is a number used by government agencies to characterize the quality of the air at a given location. As the AQI increases, an increasingly large percentage of the population is likely to experience increasingly severe adverse health effects. To compute the AQI requires an air pollutant concentration from a monitor or model. The function used to convert from air pollutant concentration to AQI varies by pollutant, and is different in different countries. Air quality index values are divided into ranges, and each range is assiged a descriptor and a color code. Standardized public health advisories are associated with each AQI range.
What a mouthful. Totally unnecessary. Here is the formula....
Get rid of the maths and just give us the raw data world wide straight off the instruments !
Have a look at THIS PAGE trying to describe the Air Quality Index (AQI) used in the US for example.
No wonder people are confused with ambient air quality readings.
Why make it so complicated using formulas and colours and numbers that go up to 500!
Give us the raw PM2.5/PM10 data straight off the instruments.
And it works out different in different countries!!
We don't have to put up with this....
The Air Quality Index (AQI) (also known as the Air Pollution Index (API) or Pollutant Standard Index (PSI)!! is a number used by government agencies to characterize the quality of the air at a given location. As the AQI increases, an increasingly large percentage of the population is likely to experience increasingly severe adverse health effects. To compute the AQI requires an air pollutant concentration from a monitor or model. The function used to convert from air pollutant concentration to AQI varies by pollutant, and is different in different countries. Air quality index values are divided into ranges, and each range is assiged a descriptor and a color code. Standardized public health advisories are associated with each AQI range.
What a mouthful. Totally unnecessary. Here is the formula....
Get rid of the maths and just give us the raw data world wide straight off the instruments !
Call for real-time air quality reporting as smoke continues to blanket Australia
First published 8th Jan.2020 at https://www.smh.com.au/national/call-for-real-time-air-quality-reporting-as-smoke-continues-to-blanket-australia-20200108-p53psh.html
Download the PDF
First published 8th Jan.2020 at https://www.smh.com.au/national/call-for-real-time-air-quality-reporting-as-smoke-continues-to-blanket-australia-20200108-p53psh.html
Download the PDF
COMMENTS: Closed early so here it is....
Can't believe there are no air monitoring stations in or around Bendigo Victoria! Surely Vic EPA learnt something from the Hazelwood coal mine fire? This is so bad and people shouldn't have to put up with that!
Professor Bin Jalaludin, from experience I disrespectfully disagree with you when you say, "..in the end it may be decided that maybe this [24-hour rolling average] is the best way." This just seems a cop out, we have advanced far beyond that standard. People shouldn't have to wait 24 hours to see what the air quality ...was.
As one of the many asthmatics living in Tasmania where we have the best EPA air monitoring network in Australia I think it is time other states caught up. If we can do it then you owe this health service to your people.
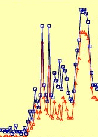
Tasmania has real-time ambient air quality monitoring (every 10 minutes) posted on the web.
We also have a stacked plot where it is easy to track smoke travel. If you want to see how it works go here: https://epa.tas.gov.au/environment/air/monitoring-air-pollution/monitoring-data/real-time-air-quality-data-for-tasmania/all-sites-graph
A DHHS air advisory alert for sensitive people is enacted on our Health web site when the hour-average PM2.5 value is above 25 µg m-3.
I am sorry but you people on the big island seem to be asleep when it comes to protecting your respiratory health. Demand better from your agencies.
Can't believe there are no air monitoring stations in or around Bendigo Victoria! Surely Vic EPA learnt something from the Hazelwood coal mine fire? This is so bad and people shouldn't have to put up with that!
Professor Bin Jalaludin, from experience I disrespectfully disagree with you when you say, "..in the end it may be decided that maybe this [24-hour rolling average] is the best way." This just seems a cop out, we have advanced far beyond that standard. People shouldn't have to wait 24 hours to see what the air quality ...was.
As one of the many asthmatics living in Tasmania where we have the best EPA air monitoring network in Australia I think it is time other states caught up. If we can do it then you owe this health service to your people.
Tasmania has real-time ambient air quality monitoring (every 10 minutes) posted on the web.
We also have a stacked plot where it is easy to track smoke travel. If you want to see how it works go here: https://epa.tas.gov.au/environment/air/monitoring-air-pollution/monitoring-data/real-time-air-quality-data-for-tasmania/all-sites-graph
A DHHS air advisory alert for sensitive people is enacted on our Health web site when the hour-average PM2.5 value is above 25 µg m-3.
I am sorry but you people on the big island seem to be asleep when it comes to protecting your respiratory health. Demand better from your agencies.
Simple tools to measure air quality
"Although Tasmania has the worst health record in the nation in many areas, I do believe we have the best air quality regulations and monitoring in Australia."
This article was first published in The Mercury January 1, 2020
"Although Tasmania has the worst health record in the nation in many areas, I do believe we have the best air quality regulations and monitoring in Australia."
This article was first published in The Mercury January 1, 2020
2019 Award Winners - Two from Tasmania
Clean Air Society of Australia and New Zealand CASANZ
Clean Air Medal Dr John Innis, Senior Scientific Officer, Air, EPA Tasmania
Air Quality Champion Award Dr Fay Johnston, Tasmanias Menzies Institute for Medical Research
Clean Air Society of Australia and New Zealand CASANZ
Clean Air Medal Dr John Innis, Senior Scientific Officer, Air, EPA Tasmania
Air Quality Champion Award Dr Fay Johnston, Tasmanias Menzies Institute for Medical Research
Can This Cheap, DIY Air Pollution Sensor Help the World Get Clean Air?Columbian citizen scientists built dirt-cheap air quality monitors and deployed them across their city, forcing the government to confront its pollution. Now theyre teaching others to build them, too.
Low-Cost Home Air Quality Monitors Prove Useful for Wildfire Smoke
Published recently in the journal Sensors, their study tested four models of low-cost air quality monitors during actual wildfire pollution events and found that their readings of PM2.5 or particulate matter under 2.5 microns, which has been linked to respiratory and cardiovascular issues were consistently higher than the reference monitor used by the regulatory agencies; however, since each monitor had a relatively consistent response to the smoke, it is possible to use the readings to estimate true PM2.5 levels. Overall, the researchers concluded that the monitors can provide actionable information.
Published recently in the journal Sensors, their study tested four models of low-cost air quality monitors during actual wildfire pollution events and found that their readings of PM2.5 or particulate matter under 2.5 microns, which has been linked to respiratory and cardiovascular issues were consistently higher than the reference monitor used by the regulatory agencies; however, since each monitor had a relatively consistent response to the smoke, it is possible to use the readings to estimate true PM2.5 levels. Overall, the researchers concluded that the monitors can provide actionable information.
Microplastics are contaminating our air
Microplastics from the ocean are being transported in the wind and are polluting our air.
The researchers have highlighted that this 11% from sea spray is particularly alarming.
Having analysed where this pollution came from, the researchers found that oceanic action grinds plastic waste in the ocean into micron-size particles, where the wind then transports them into the atmosphere.
Commercial aircraft continue to fly, with no contaminated air warning systems to inform passengers and crews when the air they are breathing is contaminated.
Captain Tristan says the air onboard passenger planes is contaminated because of bleed air, which brings air in through the compression section of the engines, or from the auxiliary power unit, a small engine at the tail of the aircraft. He says it is not filtered and has been known to be contaminated with jet engine oils and other fluids.
Captain Tristan says the air onboard passenger planes is contaminated because of bleed air, which brings air in through the compression section of the engines, or from the auxiliary power unit, a small engine at the tail of the aircraft. He says it is not filtered and has been known to be contaminated with jet engine oils and other fluids.
A new air pollution calculator will provide individuals worldwide with real-time exposure data.
The calculator, which has been developed with support from the United Nations Sustainable Development Solutions Network combines global governmental, crowd-sourced and satellite pollution data.
This is then combined with population data and artificial intelligence technology to calculate every hour country population exposure to air
Some of the readings do not match up with Tasmania's real-time PM readings...
Go HERE to see why
22.9.2021 - WHO A/Q Guidelines.
PM2.5, PM10, Ozone, Nitrogen dioxide, Sulphur dioxide& Carbon monoxide
Download HERE. (7Mb)
PM2.5, PM10, Ozone, Nitrogen dioxide, Sulphur dioxide& Carbon monoxide
Download HERE. (7Mb)
What is dust? And where does it all come from?
Take action against dust.
Send in your samples and have them analysed.
People from all around Australia have been sending their dust to Macquarie Universitys DustSafe program. Instead of emptying the vacuum cleaner into the bin, they package it up and we analyse it. As a result, we are getting to know the secrets of your dust! In total, 35 countries are part of this program.
NOTE:
Some Purple Air users are becoming dissatisfied with these sensors as they find out after they have spent their money that they do not own their data and their personal information can be on-sold.
EPA NSW make no recommendations for these sensors and says the data coming from them can be different to NSW Regulatory air monitors.
A new monitor could revolutionize the way air pollution is regulated
Have we been monitoring air pollution all wrong?
In our research, we found that there was a very difficult correlation between toxicity and the number of particles, but a relatively level correlation as soon as we looked at toxicity versus surface area.
Have we been monitoring air pollution all wrong?
In our research, we found that there was a very difficult correlation between toxicity and the number of particles, but a relatively level correlation as soon as we looked at toxicity versus surface area.
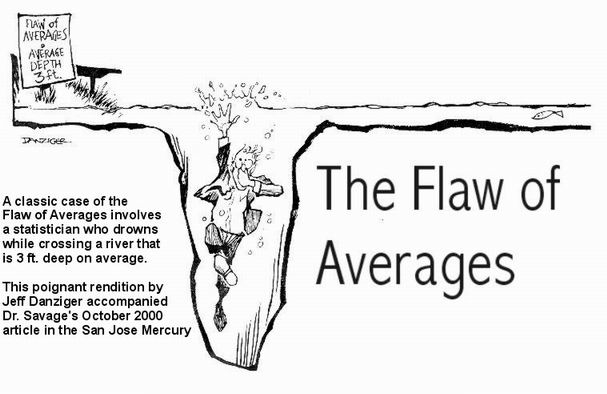
THE TROUBLE WITH AVERAGING AIR MONITORING RESULTS...
Ken Szutu says, When people ask me "What is a reasonable time interval to do AQI average?" My answer is "How long can you hold your breath?"
Ken Szutu says, When people ask me "What is a reasonable time interval to do AQI average?" My answer is "How long can you hold your breath?"
TASMANIA
Environmental Management and Pollution Control (Smoke) Regulations
The Environmental Management and Pollution Control (Smoke) Regulations 2019, usually referred to as the Smoke Regulations, are used by local government to regulate 'domestic' wood smoke in Tasmania.
The Smoke Regulations took effect on 26 June 2019, replacing the Distributed Atmospheric Emissions Regulations 2018.
Air Monitors Alone Won't Save Communities From Toxic Industrial Air Pollution
..monitors serve as a false promise to residents that the findings will be used to keep them safe. Some people believe the mere existence of monitoring is "protecting them" from harm, said Barbara Morin, an air pollution expert at a nonprofit that advises the environmental regulators of eight Northeastern states. "Unfortunately, sometimes there's just the monitoring and nothing happens to change the situation."
..monitors serve as a false promise to residents that the findings will be used to keep them safe. Some people believe the mere existence of monitoring is "protecting them" from harm, said Barbara Morin, an air pollution expert at a nonprofit that advises the environmental regulators of eight Northeastern states. "Unfortunately, sometimes there's just the monitoring and nothing happens to change the situation."
New type of extremely reactive substance in the atmosphere
An entirely new class of super-reactive chemical compounds has been discovered under atmospheric conditions. Researchers have documented the formation of so-called trioxides -- an extremely oxidizing chemical compound that likely affects both human health and our global climate.
An entirely new class of super-reactive chemical compounds has been discovered under atmospheric conditions. Researchers have documented the formation of so-called trioxides -- an extremely oxidizing chemical compound that likely affects both human health and our global climate.
Very few regulatory options are on the books for controlling wildfire smoke as an air pollutant since the fires are considered exceptional events that dont count against a regions compliance with National Ambient Air Quality Standards.
The EPA is paying closer attention to the health impacts of wildfire smoke, which is one of the leading sources of particulate matter, a top agency official said on Thursday.
https://news.bloomberglaw.com/environment-and-energy/epa-grapples-with-wildfire-smoke-in-revisiting-air-quality-laws
And,
https://news.bloomberglaw.com/environment-and-energy/wildfires-highlight-whats-gone-wrong-in-pollution-mitigation
There is no safe level of particulate pollution - WHO.
Raw Data and health-based categories
Time to change to a Binary system.
https://cleanairtas.com/air-monitoring/PM2.5_V5.2.pdf
Raw Data and health-based categories
Time to change to a Binary system.
https://cleanairtas.com/air-monitoring/PM2.5_V5.2.pdf
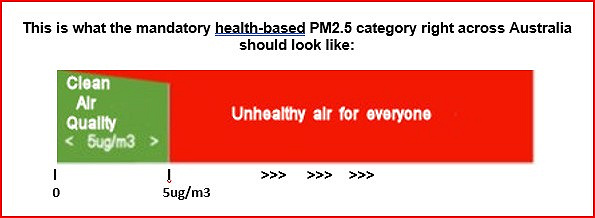
Click on the graphic to download the .PDF (44.1Kb)
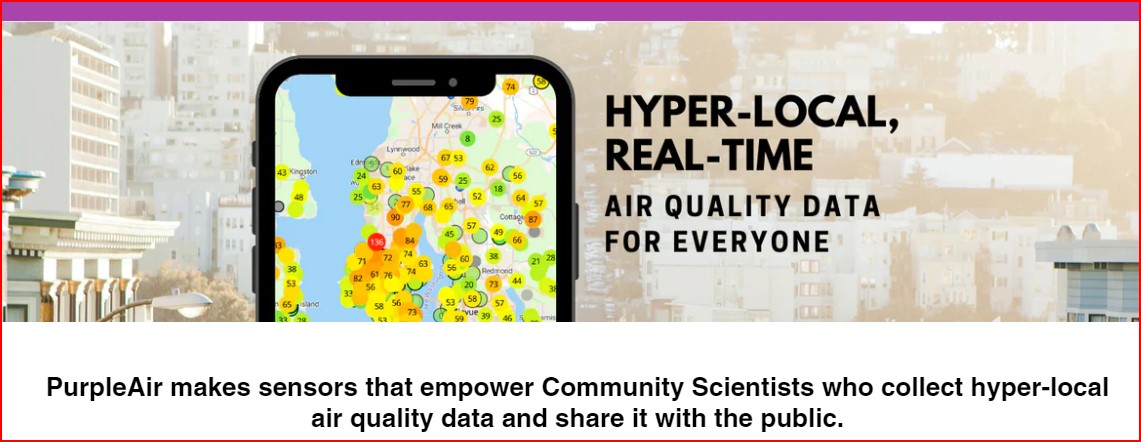
NOT 'FOR EVERYONE'
30.10.2023 - This is a screenshot (above) from the Purple Air site.
It is possible for an owner to set their sensors to 'private' so their air quality is NOT being shared with the public - see below:.
30.10.2023 - This is a screenshot (above) from the Purple Air site.
It is possible for an owner to set their sensors to 'private' so their air quality is NOT being shared with the public - see below:.
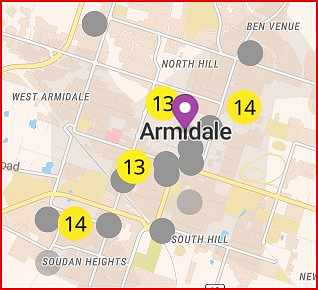
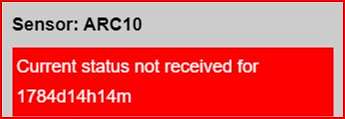
No data visible to the public for a very long time
20 Armidale Council Purple Air sensors are greyed out and not reporting
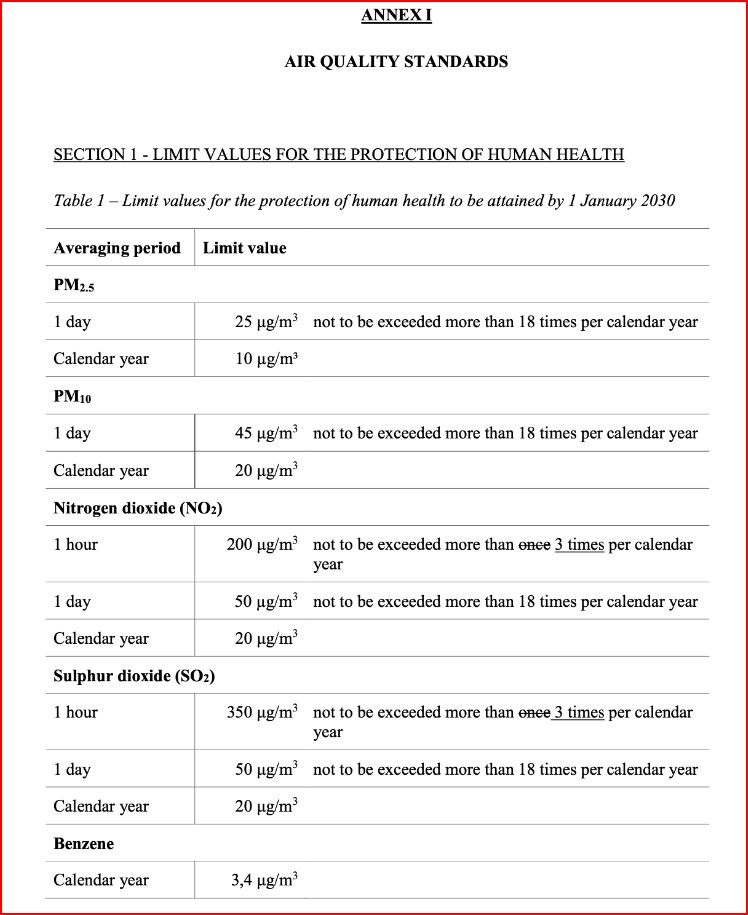
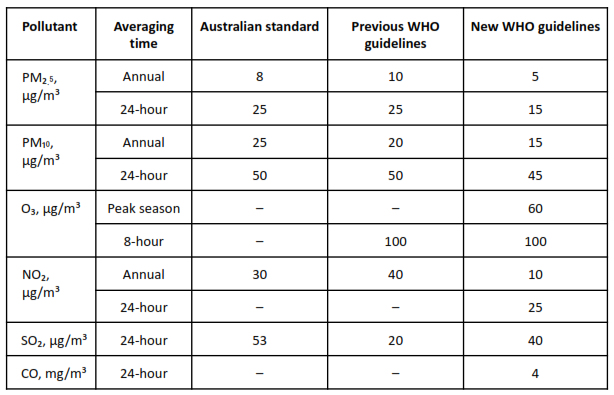
Feb 20, 2024 EU sets new air quality limits...
But look at them!
Click on the table below to read more, then read what we do in Tasmania to have some of the cleanest air in the world
But look at them!
Click on the table below to read more, then read what we do in Tasmania to have some of the cleanest air in the world
From EPA Tasmania:
The National Environment Protection (Ambient Air Quality) Measure (known as the Air NEPM) stipulates air quality standards in Australia. For PM10 there is a 24-hour standard of 50 µg m-3 (50 millionth of a gram per cubic metre). That is, if PM10 levels measured by a reference instrument averaged over a calendar day exceed 50 µg m-3, an exceedance of the standard is recorded. The Air NEPM stipulates that the reporting interval is the calendar day (midnight to midnight). The annual standard for PM10 is 25 µg m-3, with the reporting interval being the calendar year. For PM2.5, the 24-hour (calendar day) standard is 25 µg m-3, with an annual standard of 8 µg m-3. Currently there are no NATIONAL standards for PM10 or PM2.5 for intervals shorter than 24 hours.
AND NOW NOTE: There are no maximum allowable exceedances.
Comparer this with the earlier 2016 Standards further up the page.
NOTE HOWEVER:
The Tasmanian Department of Health provides the following air quality HEALTH CATEGORIES based on the HOUR-AVERAGED PM2.5 value.
Good: 0 to 9 micrograms per cubic metre
Fairly Good: 10 to 24 micrograms per cubic metre
Fairly Poor: 25 to 49 micrograms per cubic metre
Poor: 50 to 99 micrograms per cubic metre
Very Poor: 100 to 299 micrograms per cubic metre?
Extremely Poor: Over 300 micrograms per cubic metre?
TASMANIA USES 10 MINUTE near REAL-TIME REPORTING
TASMANIA DOES NOT USE AIR QUALITY INDEX (AQI)
PM2.5 values below 5 µg m-3 signify very clear air
Poor ambient air quality is not about telling people to wear face respirators, to lock themselves up inside, to use air purifiers, or not to exercise outdoors.
What about stopping the pollution at the source so all people can lead normal, healthy, happy lives?
Click on the graphic HERE. Read the article HERE.
What about stopping the pollution at the source so all people can lead normal, healthy, happy lives?
Click on the graphic HERE. Read the article HERE.