2008 Photos
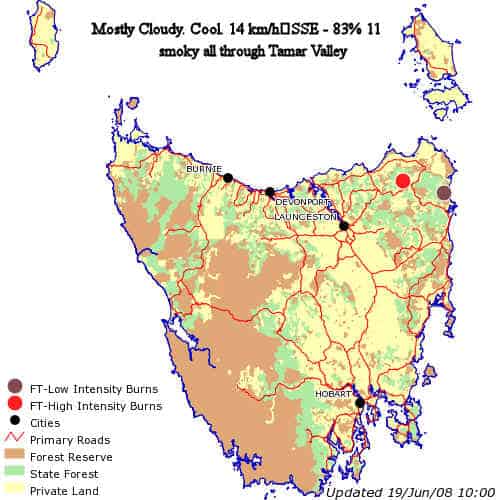
13/5/2008 This is what we breathe……
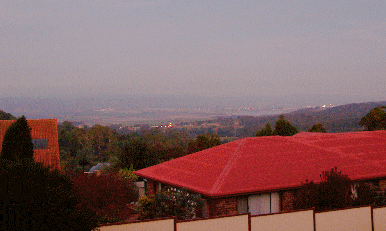
and why…….
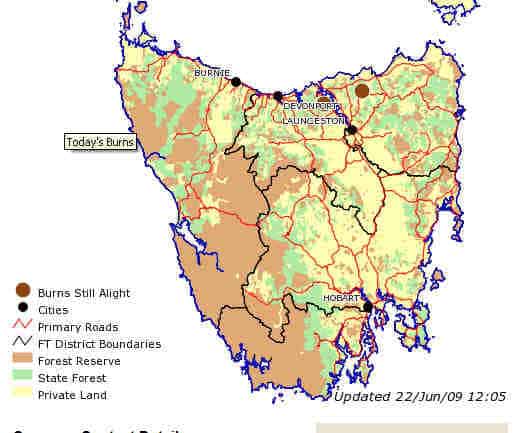
Note the location of the fires and the wind direction
details below the map.
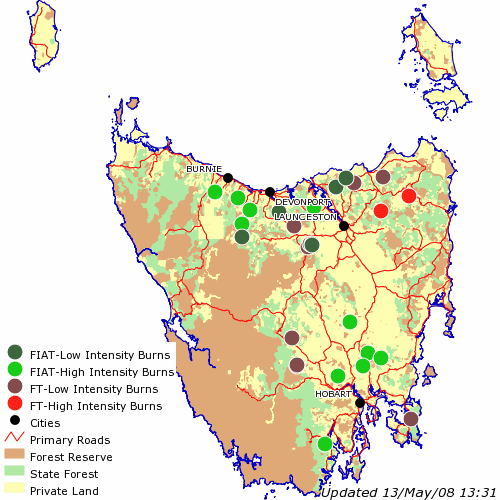
13.5.2008 Map courtesy of Tasmanian Forestry Industries, the ones making the smoke.
24 planned burns.
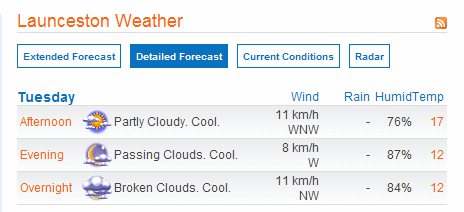
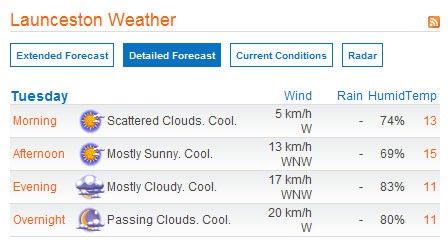
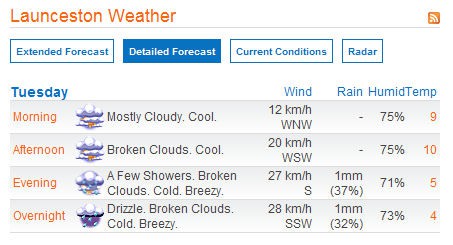
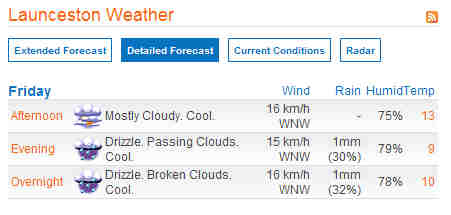
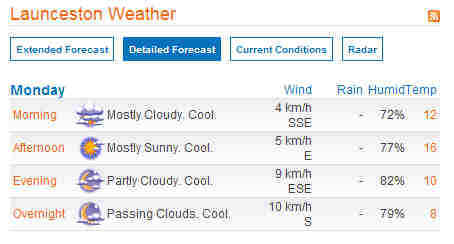
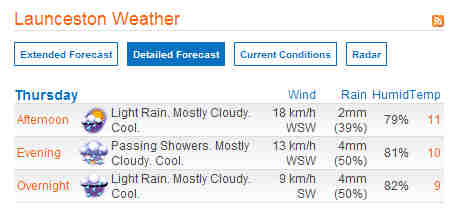
13/5/2008 weather courtesy of weather.com.au
19/6/2008
Smoke from Forestry Tasmania High Intensity burn heads
to Tamar Valley for the next few days under the wind direction as shown.
2009 Photos
Nothing has changed.
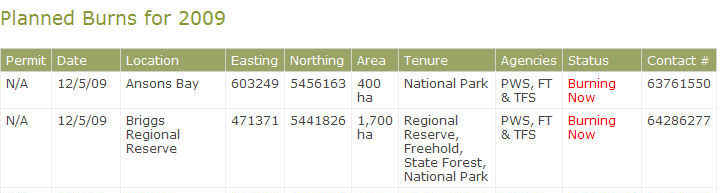
12/5/2009
12/5/09 – Tamar Valley smoked out by
FT, PWS & TFS.
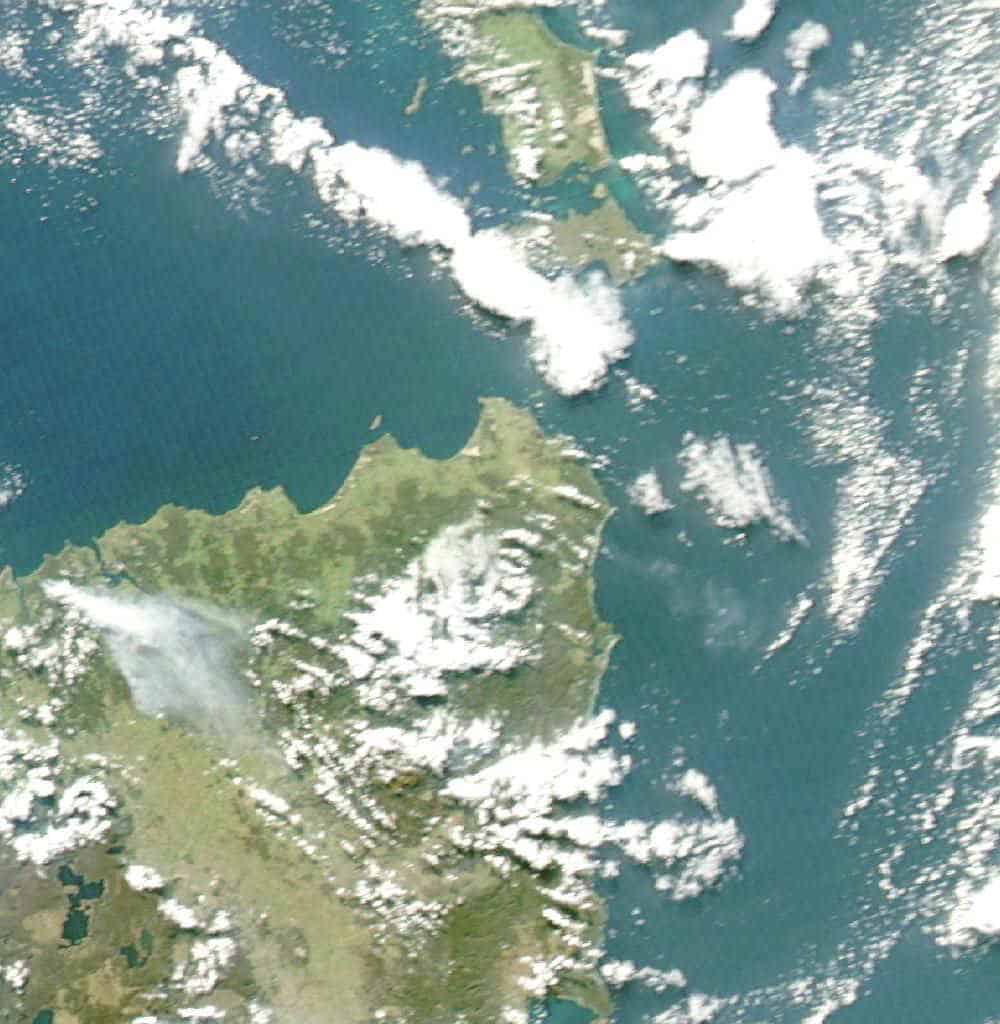
The smoke can be seen from space.
12/5/09 – Tamar Valley smoked out by
FT, PWS & TFS.
The smoke can be seen from space.
9/6/2009 – Smoke comes right across the
West Tamar Highway and fills the valleys to Beaconsfield, Tamar valley, and beyond.
Visibility was down to a few Km
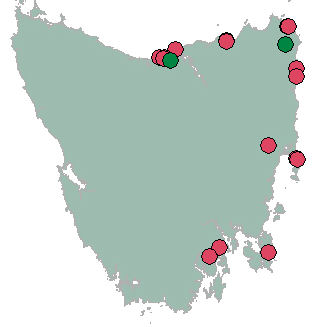
Brown dots: Forestry Tas low intensity
smoky burn.
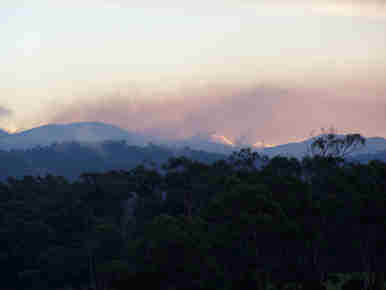
9/6/2009
Smoke blanket in the Tamar Valley during the night. This is what you breathe.
It came up the Tamar River from the burn towards Devonport.
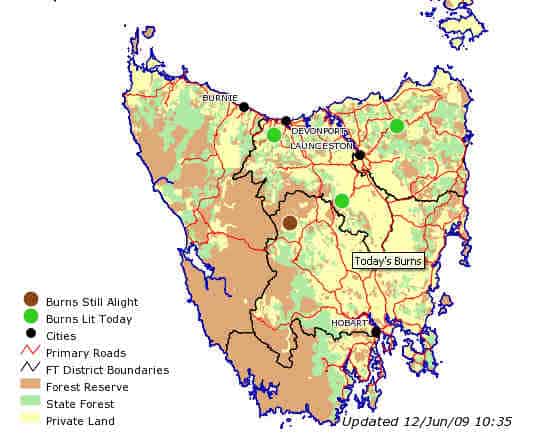
Green dots: Forestry Tas low intensity
smoky burns lit today.
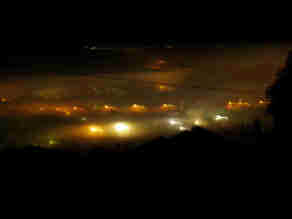
12/6/2009
Tamar Valley completely smoked out.again today.
Visibility is down to 2Km.
22.6.2009 – Tamar Valley smoked out.
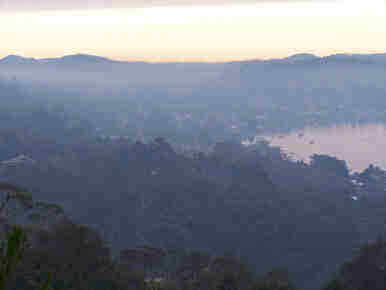
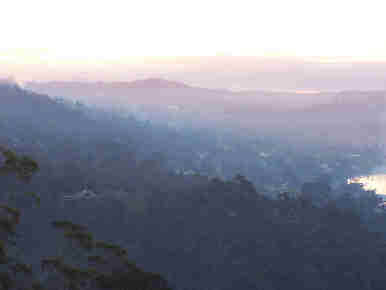
25/6/2009 – Picture taken from Brady’s Lookout.
Smoke is thick and widespread and the township of Exeter is choking.
Visibility is down to less than 1Km.
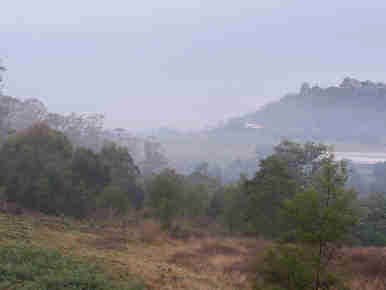
Picture taken in the other direction. Grindelwald is copping it, so is the West Tamar Highway. The Tamar Valley is full of smoke and nothing towards Launceston is visable. Visibility is down to less than 2Km.

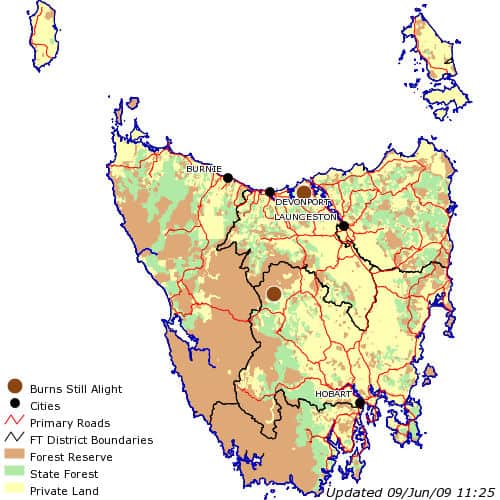
Forestry Tasmania – burns still alight 12:20pm
Smoky wet low intensity burns
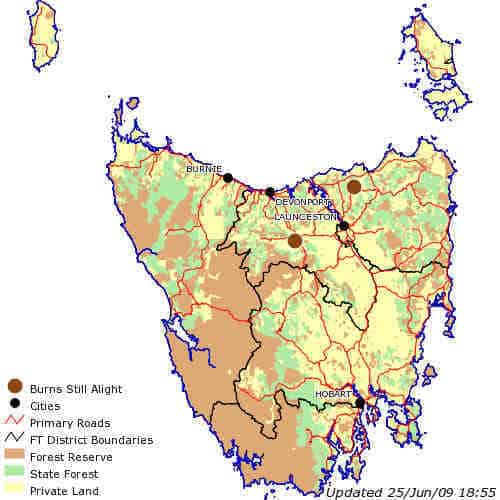
25/6/2009 – Tamar Valley and beyond smoked out.
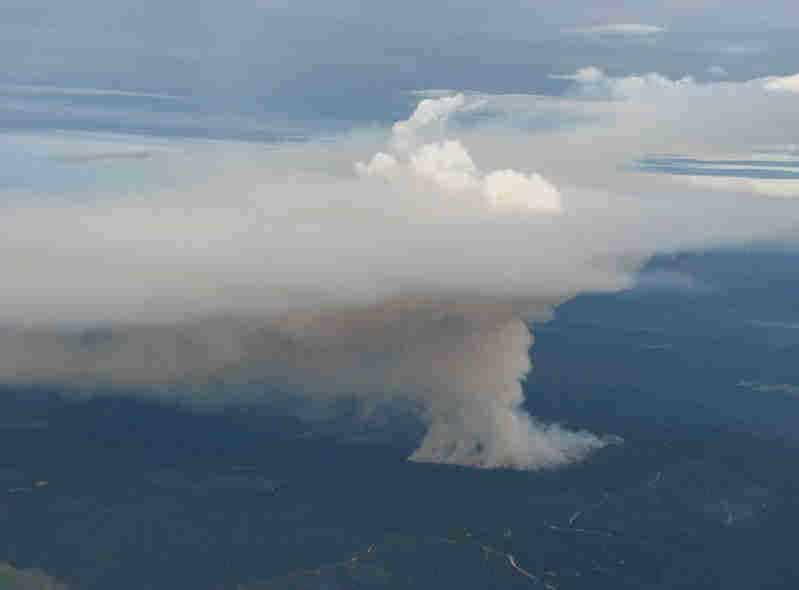
The original images show exactly how bad it was.
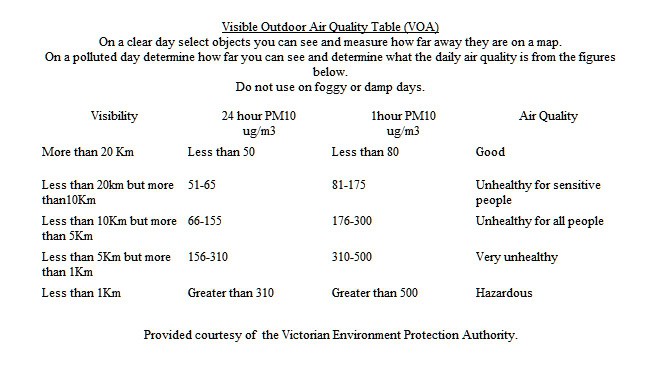
This forest industries smoke has gone on for months, every year, for years. The NEPM 24 hour Standard for PM10 Particle Pollution is 50ug/m3.
Now from the photos above, determine how bad our air quality has been
by using the Visible Air Quality table.