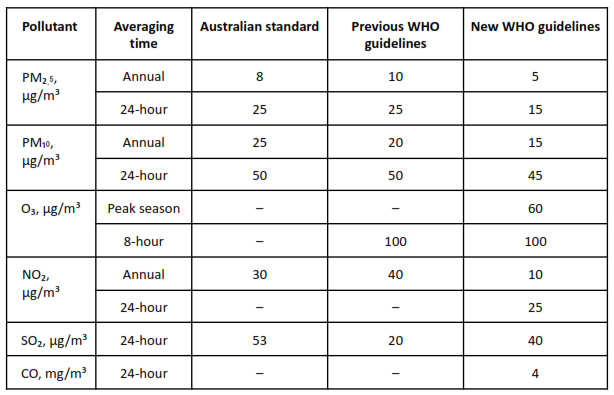
22.9.2021 – WHO A/Q Guidelines.
PM2.5, PM10, Ozone, Nitrogen dioxide, Sulphur dioxide& Carbon monoxide
Download HERE. (7Mb)
TASMANIA
Environmental Management and Pollution Control (Smoke) Regulations
The Environmental Management and Pollution Control (Smoke) Regulations 2019, usually referred to as the Smoke Regulations, are used by local government to regulate ‘domestic’ wood smoke in Tasmania.
The Smoke Regulations took effect on 26 June 2019, replacing the Distributed Atmospheric Emissions Regulations 2018.
Comprehensive information in relation to Tasmanian air quality can be found on the EPA – Air website.
Go here to read Tasmania’s Indicative Pm2.5 and PM10 Real Time Air Quality Data – updated every 10 minutes from the Base-Line Air Network for EPA Tasmania system (BLANkET).
In the main these real-time readings cannot be used to determine if there has been an exceedance of the Ambient Air – National Environment Protection Measure. (Air NEPM).
The light scattering lazer particle counters are an equivalent measuring instrument under the current Australian NEPM Standards. They give us an almost real – time air quality reading whereas it can take several weeks to get a validated air quality reading from a gravimetric (weight of particles, not number of particles) style monitor.
Depending on pollution source, wind direction, and where fixed air monitors are positioned, it is possible there will be gaps in our air monitoring. Mobile or portable monitors are being used to ‘plug some of these holes’
From 2012 all air quality complaints are to be reported to the EPA, however, only major incidents will be investigated.
24 / 7 Hotline number: 1800 005 171.
Email: incidentresponse@environment.tas.gov.au
22.9.2021 – WHO’s new Air Quality Guidelines released.
The WHO has stuck to 24 hour averaging for PMs. Why?
Tasmania uses 1 hour rolling average.
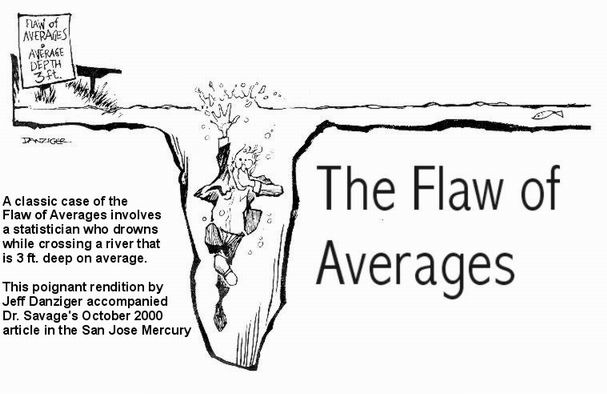
THE TROUBLE WITH AVERAGING AIR MONITORING RESULTS…
Ken Szutu says, “When people ask me “What is a reasonable time interval to do AQI average?” My answer is “How long can you hold your breath?”
In Victoria there is a Visibility Reducing Particles NEPM with a 1 hour averaging period, a 20Km objective, and a goal of 3 days a year maximum.
Click on the graphic to download the .PDF (44.1Kb)
NEPMs in Tasmania
In Tasmania, NEPMs are State Policies in accordance with section 12A of the
State Policies and Projects Act 1993. They are generally not directly
enforceable and are implemented using a variety of mechanisms and
approaches depending on the particular contents of each NEPM.
Information on how each of the NEPMs is being implemented in Tasmania can
be found in NEPC annual reports
28 October 2014 – BLANkET wins Werner Strauss Clean Air Achievement Award.
Dr John Innis accepts the award on behalf of the Tasmanian EPA team from Ms Polly Strauss.
Photo courtecy of CASANZ
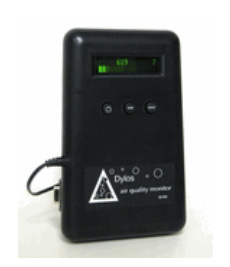
DYLOS DC1100 Pro air quality monitor with PC interface.
Cleanairtas recommends this low cost true lazer particle counter with 2 size ranges.
This instrument can hold it’s own alongside much higher priced air quality monitors.
Prices are in US dollars and it is advisable to purchase an additional serial-to-USB converter to connect it to your computer.
November 2018 – DC1700 model:
Provides particle concentration by size (>0.5 and > 2.5 micron) to correlate with ISO standards”
· Provides particle mass in PM2.5 and PM10 to correlate with EPA
· Convenient switching between particle concentration and particle mass.

Hobart health risked by cruise ships?
Background Briefing’s shocking report
EPA’s position with regards to ships in Hobart
“Ship engine exhaust emissions in waters around Australia -an overview” by L Goldsworthy and I.E. Galbally
http://www.abc.net.au/news/2015-05-28/nsw-port-authority-suspends-overnight-ship-berthing/6502302

Right to Information – May 2019 – TT-Line’s Decision not to release reports on it’s on-board air monitoring.
Our EPA IS NOT charged with monitoring on-board vehicular/passenger ferry air quality.
Click on the picture below to download about black dust on Spirit I & II of Tasmania.
These are the state-owned TT-Line passenger/vehicular ferries that run between Tas. and the mainland.
Looking at our planet and its environment

Global forecast plots.
Every day, the Copernicus Atmospheric Service (CAMS) provides five-day forecasts of aerosols, atmospheric pollutants, greenhouse gases, stratospheric ozone and the UV-Index.
Clink on the Atmoshheric Monitoring Service above.
The Copernicus Atmosphere Monitoring Service supports many applications in a variety of domains including health, environmental monitoring, renewable energies, meteorology and climatology.
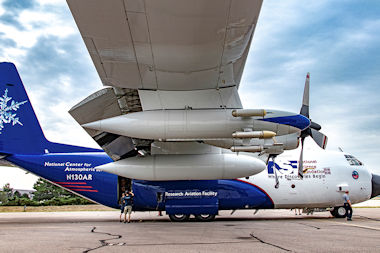
Scientists fly C-130 into the heart of smoke plumes – click on the photo
This summer, NOAA and NASA are teaming up on a massive research campaign called FIREX-AQ that will use satellites, aircraft, drones, mobile and ground stations to study smoke from wildfires and agricultural crop fires across the U.S. Hundreds of scientists will explore the chemistry of trace gases and aerosols in smoke to uncover its secrets, improve weather and air quality models, and provide better forecasts to first responders, public health and land management officials. … “.
Where theres fire theres smoke and secrets for science to uncover
BioUrban robotic tree fights pollution by performing the work of 368 real trees
Calls for air quality monitoring as northern NSW braces for severe bushfire season
More than 500,000 people live between Tweed Heads and Newcastle.
None of the State Government’s network of 85 permanent air monitors are located between Tweed Heads and Newcastle.
Now, DPIE’s director of climate and atmospheric science, Matthew Riley, said establishing a station on the North Coast was a priority because of its significant population growth.
The DPIE would “undoubtedly” be monitoring on the North Coast within the next five years, he added.
A pair of 16ft lungs made from steel, wood and fibreglass were installed beside City Hall today to help visualise the impact of pollution on Londoners’ breathing.
84% of Londoners surveyed were worried about health risks from toxic particles in their airways.
The lungs are filled with different colours of smoke to represent levels of different pollutants inhaled in the capital every day.
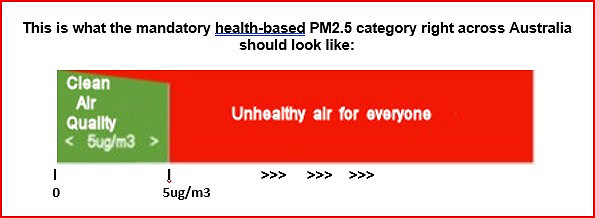
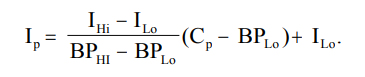
THE AQI SYSTEM FOR REPORTING AIR QUALITY IS REDICULOUS!
Have a look at THIS PAGE trying to describe the Air Quality Index (AQI) used in the US for example.
No wonder people are confused with ambient air quality readings.
Why make it so complicated using formulas and colours and numbers that go up to 500!
Give us the raw PM2.5/PM10 data straight off the instruments.
And it works out different in different countries!!
We don’t have to put up with this….
The Air Quality Index (AQI) (also known as the Air Pollution Index (API) or Pollutant Standard Index (PSI)!! is a number used by government agencies to characterize the quality of the air at a given location. As the AQI increases, an increasingly large percentage of the population is likely to experience increasingly severe adverse health effects. To compute the AQI requires an air pollutant concentration from a monitor or model. The function used to convert from air pollutant concentration to AQI varies by pollutant, and is different in different countries. Air quality index values are divided into ranges, and each range is assiged a descriptor and a color code. Standardized public health advisories are associated with each AQI range.
What a mouthful. Totally unnecessary. Here is the formula….
Get rid of the maths and just give us the raw data world wide straight off the instruments !
Call for real-time air quality reporting as smoke continues to blanket Australia
First published 8th Jan.2020 at https://www.smh.com.au/national/call-for-real-time-air-quality-reporting-as-smoke-continues-to-blanket-australia-20200108-p53psh.html
Download the PDF
COMMENTS: Closed early so here it is….
Can’t believe there are no air monitoring stations in or around Bendigo Victoria! Surely Vic EPA learnt something from the Hazelwood coal mine fire? This is so bad and people shouldn’t have to put up with that!
Professor Bin Jalaludin, from experience I disrespectfully disagree with you when you say, “..in the end it may be decided that maybe this [24-hour rolling average] is the best way.” This just seems a cop out, we have advanced far beyond that standard. People shouldn’t have to wait 24 hours to see what the air quality …was.
As one of the many asthmatics living in Tasmania where we have the best EPA air monitoring network in Australia I think it is time other states caught up. If we can do it then you owe this health service to your people.
Tasmania has real-time ambient air quality monitoring (every 10 minutes) posted on the web.
We also have a stacked plot where it is easy to track smoke travel. If you want to see how it works go here: https://epa.tas.gov.au/environment/air/monitoring-air-pollution/monitoring-data/real-time-air-quality-data-for-tasmania/all-sites-graph
A DHHS air advisory alert for sensitive people is enacted on our Health web site when the hour-average PM2.5 value is above 25 µg m-3.
I am sorry but you people on the big island seem to be asleep when it comes to protecting your respiratory health. Demand better from your agencies.
Simple tools to measure air quality
“Although Tasmania has the worst health record in the nation in many areas, I do believe we have the best air quality regulations and monitoring in Australia.”
This article was first published in The Mercury January 1, 2020
2019 Award Winners – Two from Tasmania
Clean Air Society of Australia and New Zealand – CASANZ
Clean Air Medal – Dr John Innis, Senior Scientific Officer, Air, EPA Tasmania
Air Quality Champion Award – Dr Fay Johnston, Tasmania’s Menzies Institute for Medical Research
A new air pollution calculator will provide individuals worldwide with real-time exposure data.
The calculator, which has been developed with support from the United Nations Sustainable Development Solutions Network combines global governmental, crowd-sourced and satellite pollution data.
This is then combined with population data and artificial intelligence technology to calculate – every hour – country population exposure to air
Some of the readings do not match up with Tasmania’s real-time PM readings…
Go HERE to see why
What is dust? And where does it all come from?
Take action against dust.
Send in your samples and have them analysed.
People from all around Australia have been sending their dust to Macquarie University’s DustSafe program. Instead of emptying the vacuum cleaner into the bin, they package it up and we analyse it. As a result, we are getting to know the secrets of your dust! In total, 35 countries are part of this program.
NOTE:
Some Purple Air users are becoming dissatisfied with these sensors as they find out after they have spent their money that they do not own their data and their personal information can be on-sold.
EPA NSW make no recommendations for these sensors and says the data coming from them can be different to NSW Regulatory air monitors.
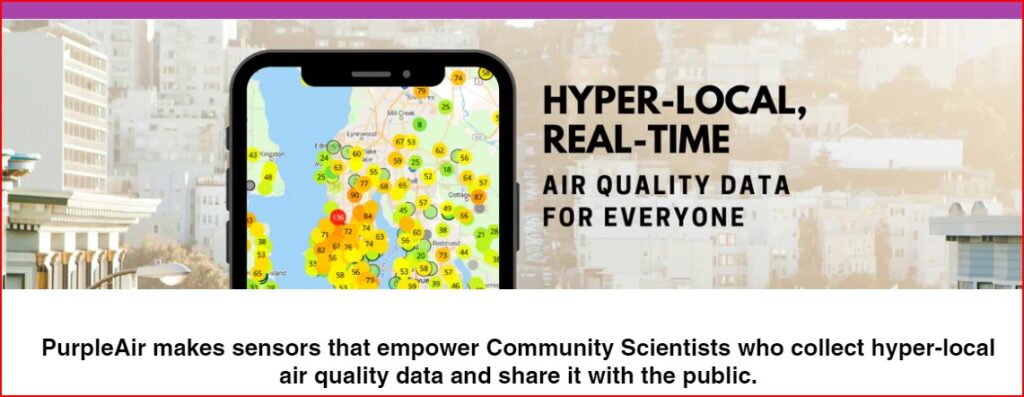
NOT ‘FOR EVERYONE’
30.10.2023 – This is a screenshot (above) from the Purple Air site.
It is possible for an owner to set their sensors to ‘private’ so their air quality is NOT being shared with the public – see below:.
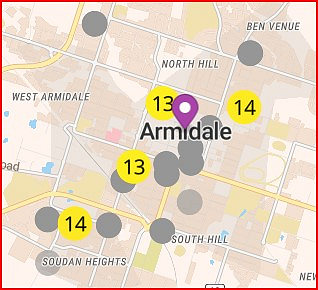
20 Armidale Council Purple Air sensors are greyed out and not reporting
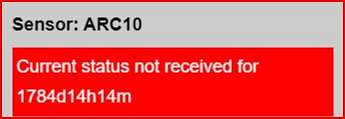
No data visible to the public for a very long time
Our Mission Is To Fight Against Harmful Air Pollution By Using Private And EPA Real-Time Air Quality Data, Advocating For Better Regulations With Stricter Penalties, And Educating The Public About The Harmful Effects Of Polluted Air.
Copyright © 2025 Cleanairtas. All rights reserved.